

Prologue
Now before writing about this topic, I did a quick Google Search to see how much of this is already covered and quickly observed a phenomenon that I see increasingly in the field – Data Science = Modelling, at best, Modelling + Data Processing. Open a MOOC, they talk about the different models and architectures, go to a bootcamp, they will make you write code to fit and train a machine learning model. While I understand why the MOOCs and bootcamps take this route (because these machine learning models are at the heart of data science), they sure have made it seem like machine learning models are the only thing in Data Science. But Data Science in practice is radically different. There are no curated datasets or crisply formatted notebooks, only a deluge of unorganized, unclean data, and complex processes. And to effectively practice Data Science there, you need to be a good programmer. Period.
Fact: Nobody writes perfect code

Not even John Skeet – the Chuck Norris of Programming. It is an inevitable and irritating part of writing code. There is nothing like a long and obscure error message to bring down the high of coding up a particularly complex task. And therefore, being able to hunt down and deal with errors is an essential skill in a Data Scientist’s toolbox.
Machine Learning is slightly different from conventional programming. Traditionally programming tries to solve a problem and there will be a set of steps/logic which has to be translated into code and voila! it works. But Machine Learning is slightly frustrating in that aspect. You can do everything right, but still fail to achieve your intended result. And because of that, debugging a machine learning program is doubly hard.
An error in a machine learning code can come from two very distinct sources –
- Pure Programming/Logic issues (including data processing logic)
- Problem and Model formulation
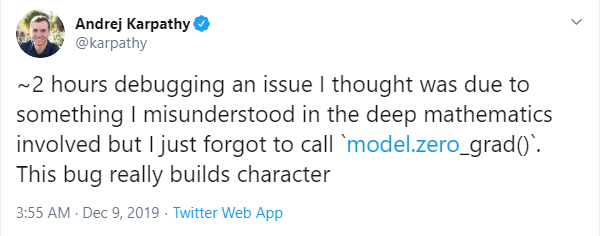
And as Andrej Karpathy alluded, the majority of errors are usually because of number 1. So before you delve deep into the mathematics, do a basic sanity check to see if you have coded it up right. This doesn’t depend on how good you are at programming or how experienced you are. Andrej Karpathy is a PhD in Computer Science from Stanford, gone on to having a stint at OpenAI, and is not the Sr. Director of AI at Tesla. Now that’s an impressive profile, isn’t it? And he has written numerous blogs about a lot of topics which shows a deep understanding of those. He even had a tweet pointing out common pitfalls in training neural networks. Guess what one of those pointers were? – “you forgot to .zero_grad()”
To summarize, even if you are Andrej Karpathy you will make errors and need to know how to debug to become effective. So the rest of the blog post, I’m gonna cover pointers on how to debug a machine learning model, both from the programmatic side as well as the machine learning side. Before getting into the specifics, I’d like to discuss a couple of ‘mindset’s which will help you go a long way.
Mindsets
1. Start calling them errors and not bugs
In Dijkstra’s classic paper “On the Cruelty of Really Teaching Computing Science”, he argues the case for calling bugs as errors, because it puts the blame squarely where is should reside – with the programmer and not on a gremlin who creeps up when we are sleeping and deletes a line, or an indentation. This change in vocabulary has a profound impact on how you approach a problem with your code. Before the program was “almost correct” with some unexplained bugs which the hero programmer will find and fix. But once you start calling them errors, the program is just wrong and the programmer, who made the error, should find a way to correct it and himself in the process. It went from a “me-against-the-world” action movie to a thoughtful, and introspective drama about a man/woman who brings a profound change in their character through the course of the movie.
2. Know that you are an idiot
In one of his lectures, Jeremy Howard mentioned something profound, and it derives directly from mindset #1.
We all have this habit… when we find a bug, we go, “Uh! I’m an idiot!” So, don’t wait to find out. I already know I’m an idiot. Let’s start working on that assumption when you are debugging.
Jeremy Howard
If something in our code isn’t working, it means that we thought worked in a particular way, isn’t working that way. So you have to start with the understanding that you are wrong about something, which could be quite hard for some people. Experienced programmers go right back to the start, and check every single step. But the new programmers have a tendency to overestimate their confidence about a particular block of code and discard them from the check. So they will fly by blocks of code which they feel pretty confident about and zero in on a block of code by declaring – “I think the problem is x“. But debugging is never about “I think the problem is..”, but about starting with “I don’t know what the problem is, cause I made a mistake.”
Programmatic Debugging
1. Don’t be scared to read the traceback

How many times have you seen a traceback like the one above and thought – Read through all of that? Hell, No!. But what you would be letting go there is a gold mine of information and a damn good starting point for debugging.
I know the traceback looks scary(and I intentionally posted a non-formatted, multi-threaded traceback on a black screen for effect), but it doesn’t have to be. If you are using a jupyter notebook or any IDE worth it’s salt, the traceback will be formatted and will be a million times easier to read. And what if I told you that you don’t need to read the entire traceback and still get good information from it?

Let’s breakdown the traceback a bit. Chad Hansen @ RealPython has made a good job about explaining the traceback and I urge you to take a look at that and skip the next paragraph(which is an excert from the original article). And for those of you who just want a summary, read ahead.
The first and foremost rule in reading a traceback is that you do it from bottom to top.
Blue box: The last line of the traceback is the error message line. This is your first clue as to what kind of error it is. Python has many type of built-in errors which lead to different kind of issues.
Green box: After the exception name is the error message. Pay very very close attention to this part because this is practically the answer to why it didn’t work. More often than not, the developers try to put in meaningful messages which can intuitively lead you to the problem.
Yellow box: Further up the traceback are the various function calls moving from bottom to top, most recent to least recent.
Red underline: The second line for these calls contains the actual code that was executed.
Chad Hansen @ RealPython
The Yellow box and the Red underline are key to localizing your error. But this particular aspect is what intimidates a lot of people, because this can be long; especially if you are using a library like Sci-kit Learn or Tensorflow. But what is great about this part is that it gives you the filenames in which the error has occured. Now to start with, you should be focusing on the part of the error that rose from your script, and consider the ones from the library as a consequence of a mistake that you have made (there are exceptions to this where there is actually a problem in the library, but the starting point of your analysis should always be introspection).
To summarize:
- Look at the Error type to understand what kind of error is thrown. Run it through google to find if somebody else also have faced the same errors.
- Read the error message and understand what may have gone wrong.
- Find the line in your script which threw the error, and think through the possibilities that can raise this particular error.
2. Binary Search
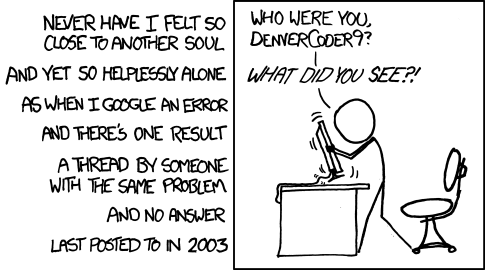
You should consider yourselves lucky if the error in your code throws an exception and a helpful traceback. But many times, the error is not so superficial. It either do not throw an error, or manifests itself in a totally different form and raises an unexplained exception. It is such errors which is the hardest to debug.
These errors typically manifests themselves in the data processing pipeline in a data science project. And, since we do not have an exact location or line number where the error occurred, we need to find that place. Now, how do you find the error in a humongous piece of code? Reading from start to finish is a sure shot way, but it’s a hugely inefficient process.
Computer Engineers will instantly tell you that when you go from Linear Search to a Binary Search, the time complexity goes from O(N) to O(log N). The irony is that these same engineers who know this at the back of their hand, will resort of a linear search while debugging.
The process is pretty simple. Let’s take an example of a simple bug. The dtype of a column in a pandas dataframe is getting changed somewhere in the code and this is messing up the data processing pipeline.
- Devise a simple test case to check the problem. For our case, it can be as simple as checking the dtype of the particular column.
- Split the code in two. You can either comment out half the code or put a logger midway through to check the dtype.
- Find the offensive split. If the dtype is what you expected at the end of the first block, the second block is the culprit and vice versa.
- Pick the offensive split, and Repeat 2-4 until you’ve zeroed in on the line where it all goes wrong.
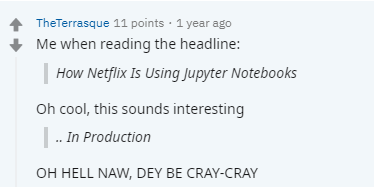
3. Ditch Jupyter Notebooks
Now that I’ve made a blasphemous statement and caught your attention, let me clarify. Jupyter Notebooks is a brilliant tool and I use it all the time, but for quick prototyping. Once you’ve made substantial progress in the coding process and you have a long block of code it becomes unwieldy.
Just imagine doing the binary search I described earlier in a notebook. If your code is split across different cells, you would be executing cell after cell, torturing your keyboard. And if your code is merged into a single cell, then you will be splitting cells, creating new cells to check, etc. It’s a major headache.
There is a fine line between debugging data science and debugging code and both of these processes require slightly different tools. If you are figuring out a kink in your model, where you have to iterate a lot and try different things, there is no better tool than Jupyter Notebooks. But if you have a hidden bug in something like a data pipeline, or feature engineering pipeline, ditch Jupyter Notebooks and use an IDE of your choice. My go-to tools are VSCode and Spyder, depending on specific use cases.
I’ve had many data scientists draw a blank face when I tell them to “step through” the code and debug it. And I notice their eyes widening when I tell them about this magical thing called the debugger which let’s you put break points, watch certain variables, let you step through the code line by line, and even put a conditional break point. And this debugger is there in almost all IDEs, functionalities remain the same on a high level. If you are one of those Data Scientist, I urge you to immediately check out debuggers, be it in VSCode, Spyder, PyCharm, or any other IDE that supports it.
4. Isolate the error source
In machine learning, an error can be because of programmatic logic or mathematics and it is important to be able to quickly diagnose and isolate the error source so that you don’t waste all day chasing an error.
I’m gonna take an example to make my point clear. I was training an LSTM for time series prediction and tinkering with the architecture to accommodate a few exogenous variables. Soon enough, I understood that the network was not training properly, the loss curve was not looking right. There could be many things that could have gone wrong here – the data processing for the LSTMs (which is always a honey trap for data leakage), the standardization that I was doing for the input matrices, the tinkering I was doing with the LSTM architecture. So, I just created a dummy time series as a function of the exogenous variables, turned off the standardization , and ran my data processing. When I checked the formatted arrays, it was alright. So I ruled out the data processing. Then I ran the data through the LSTM and watched the training loss go down. Perfect! The tinkering was also not the problem. Now that I isolated the source of the error to the standardization part of it, I placed a few breakpoints in the standardization function, stepped through the function and figured out the dumb mistake that I made.

2. Data Science Debugging
1. If the results are too good to be true, they most probably are.
Have you ever ran a model and hit 90% accuracy on a difficult problem and you feel elated that you achieved such a stellar result without putting in much effort? But, a little voice in your head is nagging you, telling you this is not possible. I’m here to hand an amplifier to that voice. Listen to it. More often than not, that voice got it right.
You must have stumbled on to the monster in data science called “data leakage”. Data Leakage is, as you all might know, when the data you are using to train a machine learning algorithm happens to have the information you are trying to predict, resulting in overstated performance. There are a lot of ways data leakage can happen in your model, some of which I’m listing below to help you kick start your train of thought-
- When you use something like Target Mean Encoding for Categorical Variables and you encode them using the entire data set, instead of just the train.
- When the data is temporal in nature and you end up using information in the future to fit the model. For eg. using K-fold cross validation.
- When there are duplicates in the data and they are split across both train and validation.
- When you run a PCA on the entire data set and use the extracted components in your model.
2. Imbalanced Dataset
If you are working on a classification problem with a high class imbalance, it has its own pitalls.
One of the most common mistake I see people make is the metric, especially when there is high class imbalance. I have sat through too many interviews where the candidate talk on and on about how he got a 90% accuracy in a xyz fraud detection type problem. Even after quite a bit of prodding and clue-dropping, most of these people don’t seem to make the connection to the Accuracy Paradox. When I remind them of Precision or Recall, I get a text book answer or the formulae. At this point, I drop any further discussion, such as the bias of F1 scores to majority class, etc.
Over or under sampling is one of the way you handle the training of an imbalanced class(which is not ideal, because you are changing the inherent distribution of the problem). But here is the kicker, if you over or undersample before you do a validation split, and measure the performance of your model on the under or over sampled dataset, you are going down a dark and windy path towards model failure.
3. Error Analysis
The errors in your model will tell you exactly the story you need to make your model perform better. And the process of extracting this story from your results is Error Analysis. When I sat Error Analysis, it includes two parts – ablation study to identify the errors/benefits from each of the components of the system, like preprocessing, dimensionality reduction, modelling, etc., and the analysis of the results and errors in them like Andrew Ng tells us to do.
You quickly identify the impact of the components of your machine learning pipeline by turning them on or off, or substituting them with the ground truth. This is also a very quick way to identify a feature with leakage. If you see that the model is relying on one single feature too much, and dropping that feature affects the performance drastically, it should be a clue to start investigating data leakage for that variable. For a review of the state of the art methods in feature attribution, check my previous blog series on interpretability.
The other part of Error Analysis is what Andrew Ng teaches in his course on Coursera. It’s all about manually going through the mis-classified cases, trying to identify a pattern, and eventually devising a plan of action to mitigate such a pattern. In case of tabular data, this process can be more efficiently classified by trying to check the performance split on different categorical splits. Is your error concentrated on a particular type of samples? May be it needs a new feature to help learning them.
In case of regression problems, you can look at the error at different categorical splits, or plot a prediction-ground truth scatter chart or a residual plot to further analyze where your errors are rising from.
Let’s do a short tour of the different visualizations provided by the excellent library Yellowbrick.
Classifier Visualizations
1. Confusion MAtrix
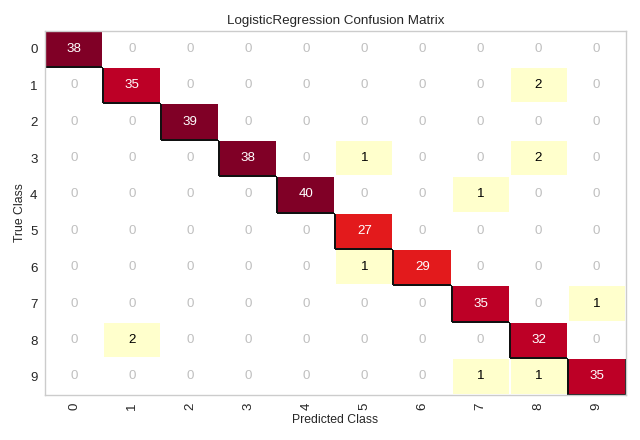
We use confusion matrices to understand which classes are most easily confused, and not because we are ourselves confused by it. So, we identify the classes which are most easily confused and analyze them to find out why. For eg. for a computer vision task, we look at the samples from these classes and check if a human can easily identify the different between the two.
2. ROC AUC Curve
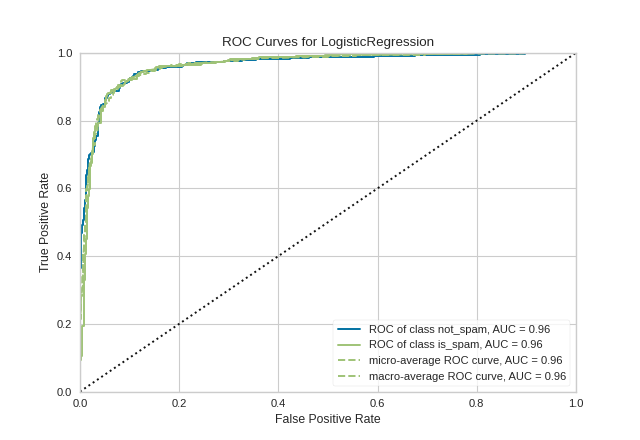
A Receiver Operating Characteristic/Area Under the Curve plot allows the user to visualize the tradeoff between the classifier’s sensitivity and specificity.
3. CLass Prediction Error
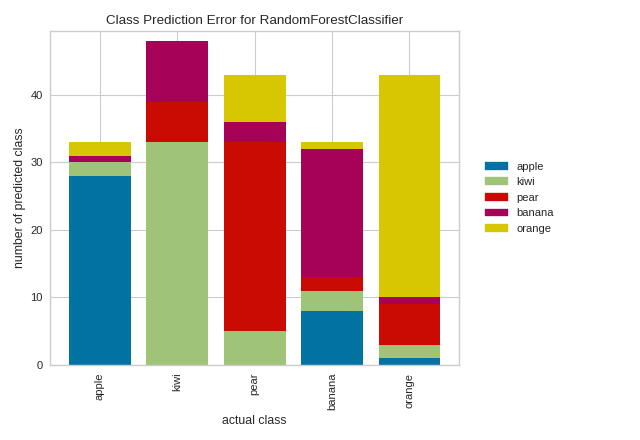
This plot is a twist on the conventional Confusion Matrix and can be used for the same purpose. For some reason, I always find this plot much more intuitive than the confusion matrix.
2. Regression Visualizations
1. Residual Plots
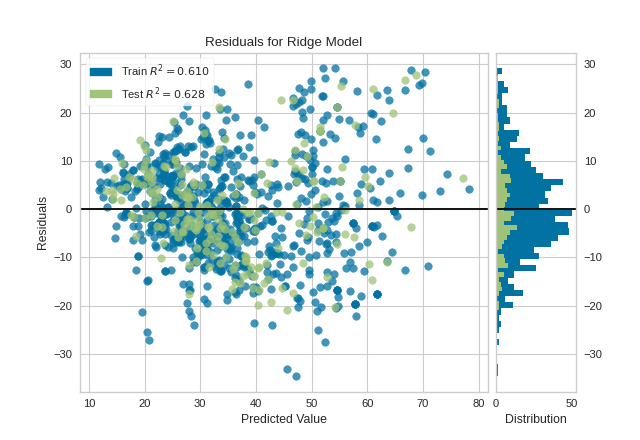
The residuals plot shows the difference between residuals on the vertical axis and the dependent variable on the horizontal axis, allowing you to detect regions within the target that may be susceptible to more or less error. This plot also shows the relation between the predicted value and how well we are able to predict that value. It also shows how the train residuals differ from the test residuals. Analyzing this plot will give you a lot of insights as to why a model is failing, or where it is failing.
2. Prediction Error Plots
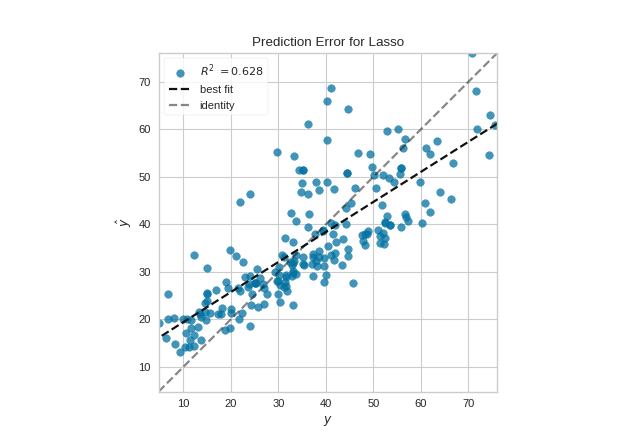
A prediction error plot shows the actual targets from the dataset against the predicted values generated by our model. We can diagnose regression models using this plot by comparing against the 45 degree line, where the prediction exactly matches the model.
This is by no means an exhaustive list of things that can go wrong, and is neither meant to be. The intention of this article is to just get your thought process started, organize your debugging efforts to be more efficient, and put in place a mindset which is conducive to debugging. If I have done any of the above for even a single person reading the article, I consider this effort worthwhile.
Go forth and Debug!
